Climate Regime Shift: From a Normal Distribution to a Right-Skewed Distribution
Climate events that were once considered exceptionally rare are occurring with increasing regularity, lasting longer, and causing greater destruction.
Introduction
One of the most useful tools in science is the normal distribution, better known as the bell curve. It provides a simple way to visualize how observations are distributed around an average and how the probability of extreme events changes when the distribution itself changes.
Climate change is often described as a rise in average global temperature. While that is true, it tells only part of the story. The more important change is statistical: the entire temperature distribution is shifting toward warmer conditions while simultaneously becoming right-skewed. In other words, not only are average temperatures increasing, but extreme heat events are becoming disproportionately more common and more intense, while extreme cold events become increasingly rare.
Understanding this change in the shape of the bell curve helps explain why today’s climate is producing so many record-breaking heat waves, marine heatwaves, droughts, wildfires, and heavy rainfall events. The average is moving—but the extremes are changing even faster.
Bell Curves
Bell curves, more formally known as normal (Gaussian) distributions, are used to describe situations where most observations cluster around a central average (the mean), while increasingly rare events occur symmetrically toward both extremes. In a stable climate regime, temperatures naturally fluctuate around a long-term average, producing a familiar bell-shaped distribution with approximately equal probabilities of unusually cold and unusually hot events.
When a bell curve becomes distorted and extends farther toward higher values, it is called a positively skewed (or right-skewed) distribution. In this case, the distribution is no longer symmetrical, indicating that extreme high values occur more frequently or reach much greater magnitudes than extreme low values.
Characteristics of a Right-Skewed Distribution
- Long, broad right tail: Extreme high values become more frequent and more severe, producing a wider, heavier right tail.
- Compressed left tail: Extremely low values become increasingly rare, resulting in a shorter, thinner left tail.
- Shifted average: The entire distribution moves toward higher values, indicating that average conditions have become warmer.
- Statistical relationship: The long right tail pulls the arithmetic mean upward, producing the relationship:Mean > Median > Mode
Familiar Examples
- Wealth distribution: Most people have relatively modest net worth, while a small number of multimillionaires and billionaires create a long, heavy right tail.
- Insurance losses from natural disasters: Most weather events cause little or no damage, but a handful of catastrophic hurricanes, floods, and wildfires account for a disproportionately large share of total economic losses.
- Climate extremes: As the climate warms, temperature distributions shift toward warmer conditions while also becoming increasingly right-skewed, making extreme heat events disproportionately more common than extreme cold events.
Implications
The implications extend far beyond temperature alone. The left and right tails of the distribution represent the probabilities of all climate extremes, not just unusually cold or hot days. As the climate system warms and the distribution becomes increasingly right-skewed, the probability of high-impact events shifts dramatically.
Extreme heat waves, marine heatwaves, intense rainfall, flash flooding, atmospheric rivers, severe droughts, wildfire conditions, and the most powerful tropical cyclones are becoming more frequent, more intense, and longer-lasting. As the right tail of the distribution expands in both length (greater extremes) and breadth (greater frequency), events that were once considered exceptionally rare are occurring with increasing regularity, lasting longer, and causing greater destruction.
This change in the probability distribution helps explain why record-breaking events are occurring with unprecedented frequency. A simple shift of the bell curve would increase average temperatures, but the emergence of a broad, heavy right tail fundamentally changes the odds. The climate system is no longer producing merely warmer versions of past weather—it is generating a growing number of events that fall far outside the historical range of experience. The result is an increasing concentration of record-breaking extremes that disproportionately drive human, economic, and ecological impacts.
Nonlinear Acceleration and the Expanding Right Tail
The right-skewed distribution provides a useful statistical framework for understanding the Nonlinear Acceleration Hypothesis. If climate change simply shifted the bell curve toward warmer temperatures, we would expect a proportional increase in hot weather. Instead, observations increasingly suggest that the distribution is not only shifting—it is also becoming increasingly asymmetric. The expanding right tail indicates that the probability of extreme events is growing faster than the increase in the mean itself. This is the statistical signature of nonlinear change: each increment of warming produces a disproportionately larger increase in the frequency, intensity, duration, and geographic extent of extreme weather events.
The physical explanation lies in the interconnected nature of the Earth’s climate system. As temperatures rise, reinforcing feedback mechanisms begin interacting with one another rather than operating independently. Increased atmospheric water vapor amplifies heavy rainfall. Hotter oceans fuel stronger tropical cyclones and marine heatwaves. Droughts increase wildfire activity, while wildfire emissions further degrade air quality and contribute additional greenhouse gases. Loss of snow and sea ice reduces planetary reflectivity, allowing more solar energy to be absorbed. Permafrost thaw releases methane and carbon dioxide, further accelerating warming. Each feedback amplifies others, creating a cascading sequence of reinforcing processes.
This domino effect causes the right tail of the distribution to expand in both length and breadth. The tail becomes longer because events are reaching unprecedented levels of severity. It becomes broader because these extreme events are occurring more frequently across larger regions and persisting for longer periods. In statistical terms, the climate system is producing an increasing number of observations far beyond the historical range—not because weather has become more random, but because the underlying probability distribution itself has been fundamentally altered.
The result is a transition from a climate characterized by relatively independent weather extremes to one increasingly dominated by compound and cascading events. Heat waves intensify drought, drought fuels wildfire, wildfire degrades air quality and alters cloud formation, while heat simultaneously increases atmospheric moisture that later falls in more intense rainfall and flash flooding. Each event raises the probability or severity of the next, creating chains of interacting hazards. These cascading impacts are precisely what one would expect if the climate system is undergoing nonlinear acceleration driven by reinforcing feedbacks.
Viewed through this framework, the expanding right tail is more than a statistical curiosity—it is the observable fingerprint of a climate system moving away from historical equilibrium. As positive feedbacks strengthen and tipping elements become increasingly interconnected, the distribution of climate extremes evolves from a simple bell curve into one dominated by an increasingly heavy right tail, where the largest and most damaging events become disproportionately more common.
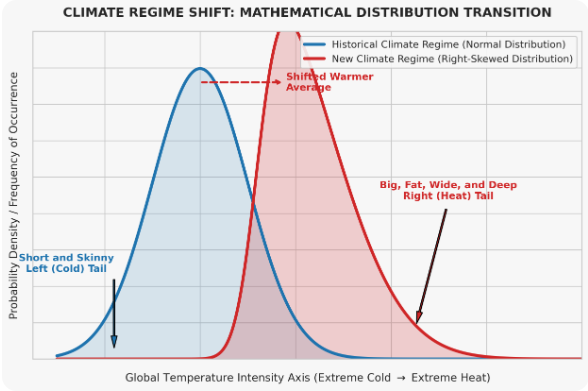
Interpreting the Diagram
The accompanying figure illustrates the transition from a historical climate regime to a modern climate regime.
The blue curve represents the historical climate, approximating a normal distribution with cold extremes on the left, hot extremes on the right, and average temperatures centered near the middle.
The red curve represents the emerging climate regime. Rather than simply shifting toward warmer temperatures, the distribution also changes shape. The entire curve moves to the right, indicating that average temperatures have increased. More importantly, the distribution becomes positively skewed: the left (cold) tail becomes shorter and thinner as extreme cold events become less frequent, while the right (hot) tail becomes broader, heavier, and extends farther into the range of extreme heat.
This distinction is important. Climate change is not merely increasing average temperatures—it is fundamentally changing the probability distribution itself. As a result, record-breaking heat becomes far more likely than would be expected from a simple shift in the average alone, while record-breaking cold becomes increasingly uncommon. Climate events that were once considered exceptionally rare are occurring with increasing regularity, lasting longer, and causing greater destruction.
Alternative Interpretation
The cold-to-hot axis represents "thermal energy in the climate system", not simply air temperature. Since more than "90% of the excess heat trapped by greenhouse gases is absorbed by the oceans", a hot-to-cold continuum more accurately reflects changes in the Earth's overall energy balance than air temperature alone.
It is also important to recognize that the right skew is difficult to fully illustrate in a simple two-dimensional graphic. The right tail is not merely shifting to the right—it is becoming "longer, fatter, and broader". In practical terms, extreme weather events are becoming "more frequent, more intense, and longer-lasting". We're also witnessing events that were once expected perhaps once or twice in a century occurring multiple times within a single year. Persistent heat domes over the United States and Europe are examples that most people can readily relate to. They illustrate not only higher peak temperatures, but also prolonged durations of dangerous heat that dramatically increase cumulative impacts on human health, ecosystems, agriculture, infrastructure, and energy systems.It is equally important to note that the graphic is "not" intended to depict only hot versus cold weather. Rather, it represents a "probability density distribution" for the full spectrum of climate extremes. Because it is a simplified bell curve, many variables, event types, and dimensions are necessarily condensed into a single conceptual illustration. The horizontal axis represents the range of climate outcomes, while the vertical axis represents their relative probability of occurrence.
The central message is therefore not simply that the climate is becoming warmer. Rather, the underlying probability distribution itself is changing in ways that make extreme events increasingly likely. Climate events that were once considered exceptionally rare are now occurring with increasing regularity, persisting for longer durations, and producing greater human, ecological, and economic damage.
Perhaps most importantly, these extreme events are no longer acting independently—they are increasingly "feeding one another through interconnected feedback loops". As the Earth's energy imbalance grows, the frequency and intensity of "feedback coupling" also increase. Heat fuels evaporation, evaporation intensifies atmospheric rivers, warmer oceans provide additional energy for tropical cyclones, persistent high-pressure systems strengthen heat domes, and greater atmospheric instability produces more powerful thunderstorms and lightning. These are all manifestations of the same excess thermal energy being redistributed throughout the Earth system. While the planetary energy imbalance itself is an abstract concept, these increasingly energetic transfers of heat into real-world weather extremes are phenomena that people can directly observe and experience. In that sense, atmospheric rivers, heat domes, severe thunderstorms, and lightning provide some of the clearest illustrations of how excess thermal energy is reshaping our climate.
Additional Examples
* Our probabilistic, ensemble-based climate model — which incorporates complex socio-economic and ecological feedback loops within a dynamic, nonlinear system — projects that global temperatures are becoming unsustainable this century. This far exceeds earlier estimates of a 4°C rise over the next thousand years, highlighting a dramatic acceleration in global warming. We are now entering a phase of compound, cascading collapse, where climate, ecological, and societal systems destabilize through interlinked, self-reinforcing feedback loops.
We examine how human activities — such as deforestation, fossil fuel combustion, mass consumption, industrial agriculture, and land development — interact with ecological processes like thermal energy redistribution, carbon cycling, hydrological flow, biodiversity loss, and the spread of disease vectors. These interactions do not follow linear cause-and-effect patterns. Instead, they form complex, self-reinforcing feedback loops that can trigger rapid, system-wide transformations — often abruptly and without warning. Grasping these dynamics is crucial for accurately assessing global risks and developing effective strategies for long-term survival.